New stats matrix
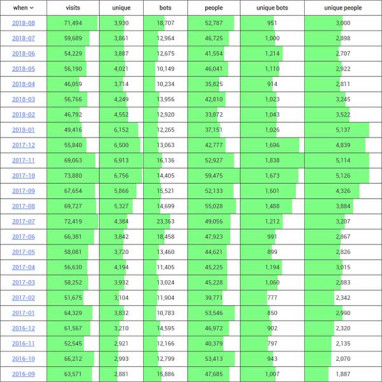 In addition to being able to graphically see visitor stats as pie charts and graphs, there is another view available that puts the data in a table with sortable columns. Each column is color-coded to illustrate the change in stats over time.
Sep 4, 2018 by
- share:


